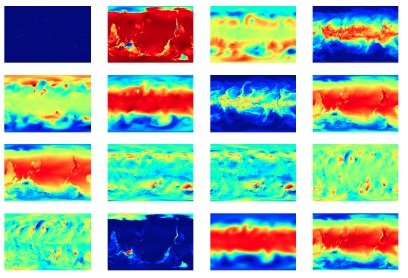
The data is available as one HDF5 file per year, which are formatted like so: “climo_yyyy.h5”, like “climo_1979.h5”.
Each HDF5 file contains two datasets:
Here is a snippet of code to load the datasets with the python library, h5py:
import h5py
data_path = "./climo_1979.h5"
h5f = h5py.File(data_path)
images = h5f["images"] # (1460,16,768,1152) numpy array
boxes = h5f["boxes"] # (1460,15,5) numpy array
The two variables, "images" and "boxes" are described below:

each row has 5 elements:
classes are types of extreme weather events and go from 0 to 3:
0. Tropical Depression
1. Tropical Cyclone
2. Extratropical Cyclone
3. Atmospheric River
The variables are the 2nd dimension of the "images" dataset in the HDF5 in the following order:
0. PRECT
1. PS
2. PSL
3. QREFHT
4. T200
5. T500
6. TMQ
7. TREFHT
8. TS
9. U850
10. UBOT
11. V850
12. VBOT
13. Z100
14. Z200
15. ZBOT
More information as to what each variable means is available here
To use this data in a paper please cite this paper:
ExtremeWeather: A large-scale climate dataset for semi-supervised detection, localization, and understanding of extreme weather events, Racah et al., 2017.